Mental Disorder deaths by ethnicity and gender
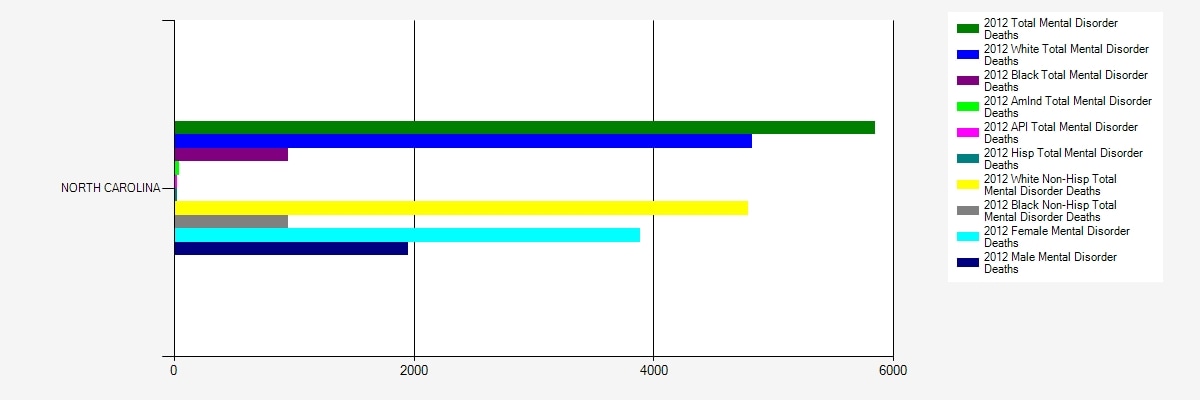
Figure. In the bar graph above, NC mental disorder deaths are graphed by ethnicity and gender according to results in 2012. While the large difference between White and Black deaths can be explained by the difference in their populations themselves, there is still a significant gap between female and male deaths. Minorities such as Hispanics reasonably have a low rate of death in comparison with ethnicities of larger population.
Hannah P.
The Office on Women's Health (2012). Quick Health Data Online. Retrieved April 24, 2017 from http://52.207.219.3/qhdo/owhexplore/GeoChart.aspx?SESSION_ID=i1yxpd55hnonwi45wmf5t345&QryType=persess
Hannah P.
The Office on Women's Health (2012). Quick Health Data Online. Retrieved April 24, 2017 from http://52.207.219.3/qhdo/owhexplore/GeoChart.aspx?SESSION_ID=i1yxpd55hnonwi45wmf5t345&QryType=persess
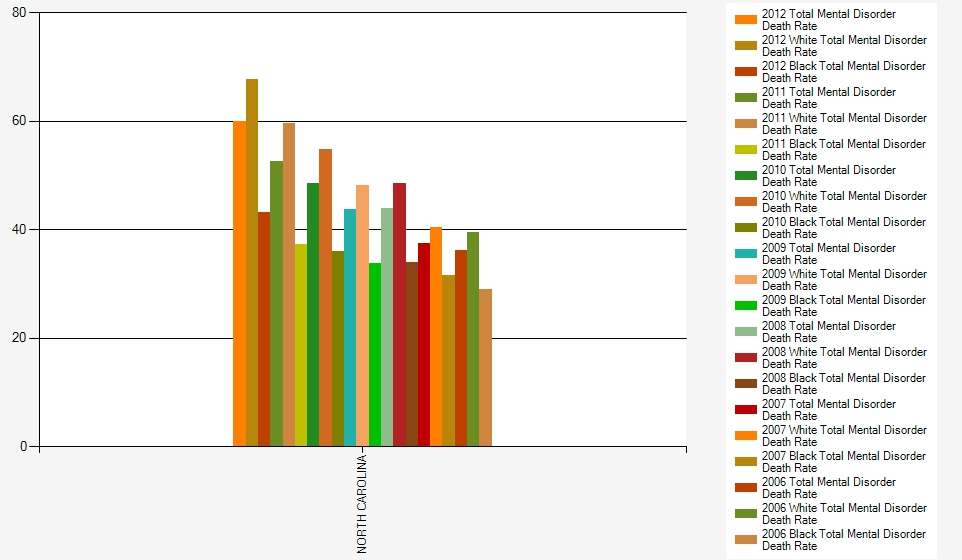
Figure: This chart describes the inequality of mental disorder deaths among the races. These major differences can be attributed to the socioeconomic differences among the races, and also location, as low income African Americans are more likely to live in overcrowded conditions. Caleb C
Data Source: Office of Women's Health; Quick Health Data Online
